Showing posts with label Data Dive. Show all posts

Tuesday, December 2, 2014

Building blast+ databases with taxonomy ID (taxid_map)

Building NCBI BLAST+ databases with linked taxonomy is far more difficult than it should be.
For example, in taxonomy-based tools such as Kraken, mapping
1) taxonomy id to sequence id (gi or accession) and
2) taxonomy id to a human-readable taxonomy tree,
are built-in and transparent to the user.
Unfortunately, with BLAST+ these steps must be completed manually and are included in two separate programs, makeblastdb for (1) and blastn/blastp/blastx for (2).

(1) Taxonomy id <–> sequence id

In BLAST+, a taxid_map file file must be created and passed to makeblastdb
makeblastdb -in <FASTA file> -dbtype nucl -parse_seqids -taxid_map taxid_map.txt 
where taxid_map.txt is a space or tab separated list of sequence ids (either gi or accession) and taxonomy ids.
For example, with gi:
taxid_map.txt
556927176 4570
556926995 4573
501594995 3914
Alternatively with accession:
taxid_map.txt
NC_022714.1 4570
NC_022666.1 4573
NC_021092.1 3914
There is no turn-key way to generate this mapping taxid to sequence_id for a moderately large set of sequencing.
Fortunately, there is always a hack work-around. NCBI allows export of both the FASTA and GenBank files. The former are used as the default input for makeblastdb, and the latter contain both the sequence_id and taxid. They can both be obtained from the NCBI, searching and exporting with Send to:
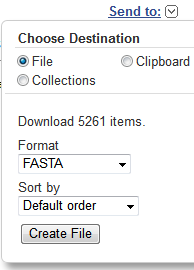
enter image description here
This simple Python code snippet will do the trick for small and moderately large datasets.
from Bio import SeqIO
genbankfile = "DNA.gb"
f = open('taxid_map.txt','w')
for gb in SeqIO.parse(genbankfile,"gb"):
    try:
        annotations = gb.annotations['gi']
        taxid = gb.features[0].qualifiers['db_xref'][0].split(':')[1]
        f.write("{} {}\n".format(annotations, taxid))
    except:
        pass
f.close()
For large datasets, the bandwidth cost of of downloading the GenBank from NCBI becomes prohibitive, and the dictionary approach would probably be warranted.
Download both the FASTA and GenBank, alternatively extract the FASTA from GenBank, e.g. with BioPython.

(2) Taxonomy id <–> Taxonomy tree

Simply include this NCBI database in the same directory as your database for the look-up to work with blastn/blastp/blastx: ftp://ftp.ncbi.nlm.nih.gov/blast/db/taxdb.tar.gz

Eating your cake

blastn -db <DATABASE> -query <QUERY> -outfmt "10 qseqid sseqid pident staxids sscinames scomnames sblastnames sskingdoms"
1,gi|312233363|ref|NC_014692.1|,86.26,310261,Sus scrofa taiwanensis,Sus scrofa taiwanensis,even-toed ungulates,Eukaryota
1,gi|223976078|ref|NC_012095.1|,86.26,9825,Sus scrofa domesticus,domestic pig,even-toed ungulates,Eukaryota
1,gi|5835862|ref|NC_000845.1|,86.26,9823,Sus scrofa,pig,even-toed ungulates,Eukaryota
Your comma separated file (-outfmt) showing human-readable taxonomy info.

Thursday, May 15, 2014

Due Diligence: Tessella


I like to do a bit of public due diligence on companies of interest. Here's a brief example of some highlights from the dossier...

Tessella is a medium-sized technology consulting company that hires a small intake of talented developers each year, many of whom have PhDs. I'm interested in Tessella, and where their past employees have gone. I'd want to use a little LinkedIn based analysis tool for this data-dive [source], but until I get access, I'll have to do it the old fashioned way (read: manually, without a slick API...the humanity!)

Macro trends

At the macro-level, massive turn-over is a negative, but if no one ever leaves, that could be bad too. You'd expect at least a few consultants to fall for a client, and go work for them; it's how ideas spread in a knowledge ecosystem. I'm specifically interested in the Boston-office, so lets compare Boston to total...

Data

Gender assignments are based on name/picture. Some of the gender numbers don't add-up due to the unavailability of this information.

Tessella, All Offices
Past: 276
Current: 193
Current + Past: 36
--> Left company: 240
--> Leaver/Current: 1.2
--> Promotion/Unpromoted: 0.23

Tessella, Boston
Past: 17
Current: 13
   Men: 9
   Women: 3
Current + Past: 2
--> Left company: 15
   Men: 13
   Women: 1
--> Leaver/Current: 1.3
--> Promotion/Unpromoted: 0.18
--> Men/Women: 22/4 = 5.5

No excess turn-over in Boston office

Self-explanatory, but some caveats...
1) Boston office is 10 years old, compared to 30 for the company as a whole; however, LinkedIn has a bias towards more recent events. A priori expect leaver/current to be higher for All offices.
2) The company has grown massively, so most of the people that have ever worked for Tessella have worked there is the past 10 years. Negates (1)
It's a wash; I'd say they're comparable.

Internal promotions are consistent between Boston and the rest of company

0.23 versus 0.18. I'd say these numbers are roughly the same given:
1) Small sample size for Boston
2) LinkedIn quirk. Not everyone listed a promotion as a separate job. I'd only detect a promotion if the person put in a separate entry. I personally know people that don't do this, thus 20 year tenures in their most senior position (for a 40 year old).
3) I wish I had a base-line metric for internal promotion. I'd be interesting to compare Tessella to peers.

White Male dominated

22:4 Men:Women for the Boston office. This is technology consulting after all. No surprises there. Of the male consultants, past and present, all but two are white. Curious how gender and diversity compare to peers. (Vet me LinkedIn!...you don't seem to present gender/racial data to the API, so I'd have to have some fun!)

Micro trends

I'm interested in where people did before Tessella, and where they go afterwards. With access to the LinkedIn API (please give me vetted access!) I could run an analysis on everyone in the company. There are 240 leavers, which is do-able by hand, but 1) I'm lazy (in the good way) and 2) to get a sense, I probably don't need to sample everyone. I'm specifically interested in the Boston office, so that's where I'll start...

Data (with homebrew classification)

Note: I made the bolded function/company classifications to help organize the data. There are of course other-ways to organize. There are only 14 people since I can't access information for the 15th.

Function...
Software Engineering: 5
Informatics/Analysis: 5
   Bioinformatics: 1
   Cheminformatics: 1
   Data Science: 1
   Industry R&D: 1
   Tech Consultant: 1
Project Management: 3
   Project Manager: 2
   Account Executive: 1
Self-employed: 1

Company...
Life Sciences Research: 2
   Broad
   Dana-Farber Cancer Institute
Life Sciences Companies: 4
   Life Technologies
   Novartis (2)
   PerkinElmer
Big Technology: 4
   BBN Technologies (Raytheon R&D)
   IDBS (IT consultancy)
   Microsoft (2)
Small Technology: 3
   Complete (Digital Marketing)
   Extreme Reach (Video ads)
   Tokyo Electron (Semi-conductors)
Finance: 1
   HighVista Strategies (Asset Management)

Some range in functional exits, but they are all technically-aligned.

10/14 exits are day-to-day technical. The 2 project managers work at NIBR (Novartis Institutes for BioMedical Research) and Life Technologies, so I'll assume that they are managing technical projects. The account executive works for IDBS, so I'll assume he's selling and overseeing technical projects. That means substantially ALL of the exits are technical. The biggest jump this group has made was to technical sales and support (account manager). It IS possible to not program day-to-day, but don't expect to stray too far from the technology function.

Some range in industry, but it's really either life sciences or tech.

6/14 in life sciences. 7/14 in technology. It's Boston after-all, I suspect the UK exits would be less life sciences dominated. Within the life sciences and technology silos, there is some diversity between Fortune500, research institutions and SMEs. Some are small, but I wouldn't consider any of them start-ups. I'd be interested in talking to the one outlier in Finance. Don't worry, he's still a techie.


Observation: People Leak on LinkedIn

I wasn't explicitly looking for this, but folks leak loads of information on LinkedIn. If it were possible to scrape and analyse this information, it would be possible to independently audit private company numbers accounts, or infer them if they don't release.


From reading profiles on LinkedIn, I inferred that Tessella will earn £21M for 2013. This is spot on with Tessella's own reporting [source], which (scouts honour) I did not view before the data-dive.


Information I observed from looking at profiles...
  • 2014: 250 people.
  • 2014: 30% PA growth in life sciences. 
  • 2011: His (two) offices (of 8) contribute ¼ of total revenue.
  • 2011, 210 staff. 160 earning, 50 admin.
  • 2011: Consulting is growing 20% PA, ⅕ of revenue. US is 17% of revenue.
  • 2011: Oversaw 37 staff, 4M GBP in revenue. 
  • 2010: Grew office to >20, >2M GBP
  • 2010: 88% of revenues are repeat business

How to estimate  £21M for 2013

£4M from his office, which is ¼ of company = £16M in 2011
- 30% life sciences...emphasizing that this is higher than average. Consulting is 20%, that it's mentioned implies it's higher than average. Let's assume 15% PA growth as a modest guess.
£16M in 2011 * 2 years at 15% = £21M in 2013
Simple example, but with a fire hose of data being automatically parsed, it may be possible to glean much much more.

Other LinkedIn Estimates

3:1 Tooth:Tail
£100k/consultant in revenues


Financials

Overall, the information available in the financials [source], line-up well with LinkedIn. Good to know that folks are bending the truth on their profiles.

There is so much gold in financials. I'm like a kid in a candy shop when I read through them. Not entirely sure it's normal, but I get positively giddy reading annual reports (financial tables first, naturally).

Many SMEs live hand-to-mouth; that's ok for start-ups, where you should be being compensated with a risk premium, but is inexcusable for an established SME. Not the case with Tessella, but it's a good idea to double check.

5:1 Tooth:Tail

(191:40   Billable:Non-billable)
Not sure how this compares to peers. My gut told me the LinkedIn estimate was a bit low. Went and checked. My gut was right. More tooth...woo!

Revenues are £110k/consultant

(21M / 191 consultants from 2013 annual report)
I think this places a natural cap on what a consultant could ever expect to earn. I'm guessing this is ball-park for a tech consultancy shop. Operations houses are pulling in 1.5-2x, while strategy houses are likely billing 3-5x.

Compensation Structure

Ok, you can't get this from the LinkedIn data...

  • £25k     Low
  • £45k     Median (est)
  • £65k     Mean
  • £160k   High
Annual report is £12M in wages (+£600k in pension cost) over 191 consultants. That's £65k/consultant in earnings versus (£21M revenue)  Highest paid director at £160k. Entry-level consultant at £25k. A 6x high-low multiple is actually fairly reasonable in this day and age. Though, the directors did gorge themselves a bit in 2012; suspect this was related to the management buy-out though. If you take the distribution of US household income as a guide, the median is about 2/3 of the mean, giving around £45k median wage.


Conclusion

If you're a tech-head, who wants to become/remain a male (kidding) tech-related-head with a technology or life sciences company, Tessella offers good exits. If you wanted to break into other areas of consultancy, say operations or strategy, or into another non-technical functions, one should probably look elsewhere. Loads of money, a la finance, also look elsewhere. 


To their credit, what I've found is exactly what's written on the tin. Tessella doesn't sell anything more, or anything less, than a solid technical training ground for new hires. Solid pass on the basic DD.


Hoping for LinkedIn Vetted API access

Just submitted a request for Vetted API access [source] on LinkedIn to do a little research project on transition probabilities. Signing up as a developer [source] only gives you access to company search and your profile and basic information from 1st degree connections.

I understand the reasons, both noble (e.g. protecting user privacy) and ignoble (e.g. enforcing a closed ecosystem, like they did with CRM, which is quite frankly evil [source]). Will just say it's more hassle than I was expecting for a simple research project.

Basically, I want to identify: 
  • People like me (starting from me)
  • Where they came from.
  • Infer where they are likely to go.
  • The co-variables that are strongly correlated (positive or negative) to particular transitions and joint-transitions.
Here's hoping that LinkedIn will provide access for my little research project. There isn't much I can do with basic profile information from 1st degree connections; need the entire network (~200k people) and non-basic profile information such as companies/universities attended to really get going.

The previous post on Tessella [source], is a very basic example of what I want to do (on a much larger scale of course) if I get vetted.

Will be using LinkedIn Python API [source]. As an aside, the code itself is beautiful. 

Saturday, April 19, 2014

Data Dive: Personality testing

Notice: I've been informed that the data were indeed crawled from a combination Adult & Youth surveys. There is no scientific value here, just a funny plug on the power of numpy, matplotlib and a few lines of bash/awk to take a hack at some data.

The Via Institute on Character offers a fun and informative ~10 min personality test. I was curious about how my results compared to the norm, so I took a little data dive.

Here are some humorous observations from a subset of their rich data-set (N=41513)...
  1. People admit to lacking Humility, Self-Regulation and Spirituality.
  2. Honesty, Love and Kindness are people's top priorities.
  3. Spirituality and forgiveness go (very weakly) hand-in-hand.

Observation #1
People admit to lacking Humility, Self-Regulation and Spirituality.

A priori, I expected the character attributes to have flat distributions (my null hypothesis), a straight line at p=0.04 (1/24 attributes). This couldn't be further from the truth for some attributes. 

In the upper-right hand corner of some images, you'll see a (+) or  (-), this corresponds to a big deviation from the flat null hypothesis.
(+) attributes are ranked higher than expected.
(-) attributes are ranked lower than expected. 
Others, without a marker, are more or less flat, e.g. Curiosity and Humor.


Observation #2
Honesty, Love and Kindness are people's top priorities.
Another slightly more flashy way to view the data is through a rank abundance plot. The  top quartile (ranks 1-6) are dominated by these three attributes: 


Observation #3
Spirituality and forgiveness go (very weakly) hand-in-hand.
Correlation coefficient plots by quartile show some very weak (+/- 0.15-0.2) correlation for top ranked (1st Q) and bottom ranked (4th Q) traits, but virtually none for average ranks (2nd and 3rd Q).

Q1 (Top Ranked attributes):
+) Spirituatlity / Forgiveness
+) Humor / Prudence+Perspective
-) Perseverance / Social Intellegence
-) Creativity / Gratitude
-) Curiosity / Perspective
-) Perspective / Creativity+Humility 

Q4 (Bottom ranked attributes):
+) Prospective / Hope+Humor
-) Appreciation / Forgiveness
-) Creativity / Humility

Note that correlation does not imply causality and the correlations, are very weak. They are, however, above the background average correlation of -0.02. These are humorous insights, and in no way should they be taken seriously.

Your Homework
Take the test for youself at viacharacter.org
If you're keen to explore, redacted datasets (taken down at the request of the VIA Institute on Character) and analysis scripts available at https://github.com/rmharrison/viacharacter-analysis


Thursday, May 17, 2012

Infographic: The Face of Life Sciences

What does a life scientist really look like? Nifty facial averaging software,[1] combined with available government statistics answers the question. Cheers!
The Face of Life Sciences
[PDF] [PNG]